
Function Plotter
See how functions behave by drawing them together. Type up to five functions of x, then zoom and drag to explore, move the cursor to read coordinates, and use the a and b sliders to watch a family of curves change shape. Intersections between the first two functions are marked automatically.
- Free to use
- No sign-up
- Runs in your browser
Function plotter
Function Graphing Practice Pack
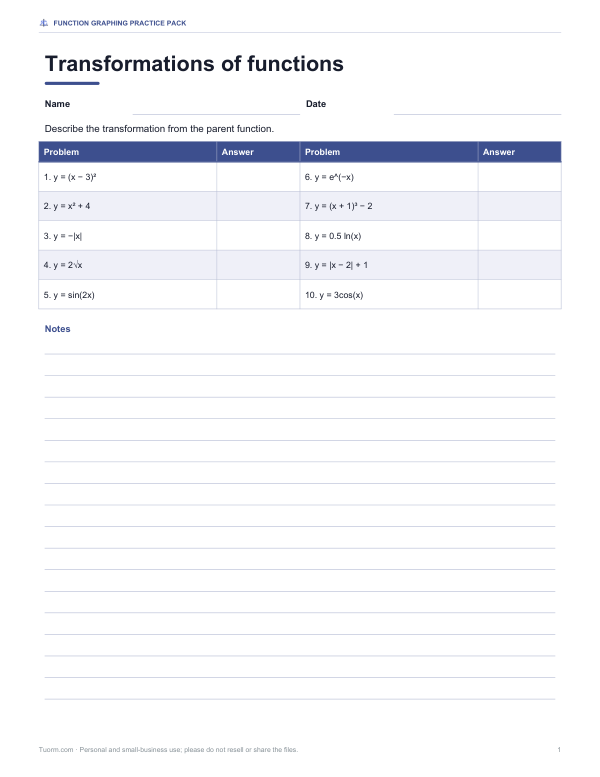
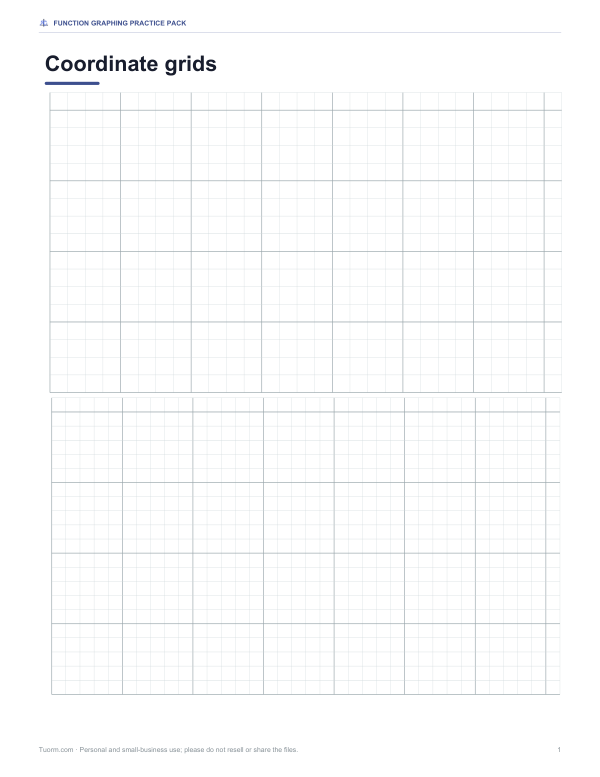
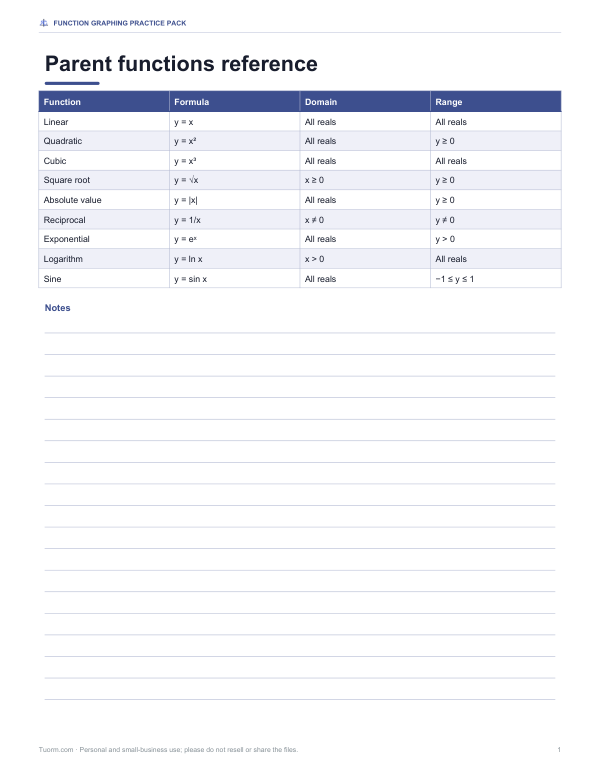
Printable graphing worksheets on transformations and function families with answer keys, coordinate grids in several scales, and a parent functions reference card.
- Transformations worksheet (PDF/DOCX)
- Coordinate grids (PDF)
- Parent functions (PDF)
Formats: PDF, DOCX. Instant download after payment (link valid 72 hours, up to 5 downloads). AI-assisted: the templates were drafted with AI help and reviewed and laid out before publishing.
$3.00 USD, one-time 3 files · about $1.00 each
- Instant download
- 7-day refund
- Secure checkout by Stripe
✓ Classroom use included
7-day money-back guarantee. Full refund within 7 days of purchase, even after you download.
Full refund within 7 days — see the refund policy and license.
License: personal and classroom use. Teachers may print and photocopy these files for the students in their own classes, and share them in a password-protected class space (e.g. Google Classroom). Please do not resell, redistribute, or post the files on public websites. One purchase covers one teacher.
Free printables
Single sheets you can print right now, no sign-up. The full pack adds every sheet in one download plus the editable files.
How to use the plotter
| Action | How |
|---|---|
| Add a function | Type it in any of the five boxes, using x as the variable |
| Zoom | Mouse wheel over the graph (zooms around the cursor), or the buttons |
| Pan | Drag the graph |
| Read values | Move the cursor: the coordinates and each function’s value appear below |
| Explore a family of curves | Use a and b in your functions and move the sliders |
| Find intersections | Put the two functions in y1 and y2; crossings in view are circled and listed |
| Save | Download as SVG (scalable) or PNG |
Supported functions: sin, cos, tan, asin, acos, atan, exp, ln (log also means ln), sqrt and abs, with the constants pi and e. Powers use ^. Angles are in radians.
Exploring parameters with sliders
Sliders turn a single graph into a whole family. With y = a*x^2 + b, moving a stretches or flips the parabola and moving b slides it up and down. With y = a*sin(b*x), a sets the amplitude and b the frequency — the period is 2π ÷ b. Try y = a*(x - b)^2 to see a horizontal shift, or y = exp(a*x) to compare growth and decay.
Worked example: where do sin(x) and a parabola meet?
Plot y1 = sin(x) and y2 = a*x^2 + b. With a = 1 and b = 0 the curves meet at x = 0 and again near x ≈ 0.877, where sin(x) = x². Move b down to −0.5 and the parabola drops, crossing the sine curve at two points either side of zero; move a to 0.1 and the flatter parabola cuts the sine wave several times across the view. The listed intersections update as you move the sliders — a quick way to see how the number of solutions of sin(x) = ax² + b depends on the parameters.
Transformations to try
| Type this | What you’ll see |
|---|---|
| x^2, (x - 3)^2, x^2 + 3 | Horizontal and vertical shifts |
| x^2, 2x^2, 0.5x^2 | Vertical stretch and compression |
| sqrt(x), -sqrt(x), sqrt(-x) | Reflections in the axes |
| exp(x), ln(x), x | Inverse functions mirror in the line y = x |
| sin(x), sin(2x), 2sin(x) | Period and amplitude changes |
| abs(x), abs(x - 2) - 1 | A V shape moved by a vector |
Use “Equal scale” before comparing angles or reflections in y = x, so one unit on each axis is the same length.
Gaps and asymptotes
The plotter samples every function once per pixel column. Where a function is undefined — ln(x) for x ≤ 0, sqrt(x) for x < 0 — it leaves a gap. Where it jumps to infinity, as tan(x) does at odd multiples of π/2, it lifts the pen rather than drawing a near-vertical line across the screen. Zoom in to see fine detail; very rapidly oscillating functions such as sin(1/x) near zero can’t be shown exactly at any resolution.
Function families at a glance
| Family | Example to type | Key features to look for |
|---|---|---|
| Linear | a*x + b | Straight line; slope a, y-intercept b |
| Quadratic | a*(x - b)^2 | Parabola; vertex at (b, 0); opens up if a > 0 |
| Cubic | x^3 - a*x | S-shape; two turning points when a > 0 |
| Exponential | exp(a*x) | Growth for a > 0, decay for a < 0; always positive |
| Logarithmic | ln(x - b) | Vertical asymptote at x = b |
| Rational | 1/(x - b) | Vertical asymptote at x = b, horizontal at y = 0 |
| Trigonometric | a*sin(b*x) | Amplitude |a|, period 2π/|b| |
| Absolute value | abs(x - b) + a | V-shape with vertex at (b, a) |
Typing the examples and moving the sliders is a quick way to learn how each parameter changes the shape — and to build intuition before sketching graphs by hand.
Solving equations graphically
Any equation f(x) = g(x) can be solved by plotting both sides and finding where the curves cross — the x-coordinates of the intersections are the solutions. This works even when algebra is difficult, as with cos(x) = x, which has a single solution near x ≈ 0.739. To find zeros of a single function, put it in y1 and 0 in y2. Zoom in around each crossing to confirm there isn’t a second intersection hiding close by.
Tips for classrooms
- Project the plotter and let students predict a graph before typing it.
- Use sliders to discover how a parameter changes a graph, then write the rule.
- Download PNG images for worksheets and slides.
- Check homework solutions by finding intersections graphically.
- Compare a function with its derivative, typed by hand, to link slope and shape.
Privacy
Everything runs in your browser.
Frequently asked questions
How do I graph multiple functions?
Type up to five functions in the boxes; each gets its own colour.
Can I zoom and pan?
Yes — use the mouse wheel or buttons to zoom and drag to pan.
What are a and b?
Parameters you can use in any function and change with the sliders.
Does it find intersections?
Yes, between y1 and y2 within the current view.
Does it use degrees or radians?
Radians.
Can I save the graph?
Yes, as SVG or PNG.
How do I solve an equation with the plotter?
Plot each side as y1 and y2 and read the intersections.
Why is part of my curve missing?
The function is undefined there, such as sqrt of a negative number.
Can I plot vertical lines or circles?
Not directly — the plotter draws functions y = f(x). For a circle, plot sqrt(r^2 - x^2) and its negative.
What does “Equal scale” do?
It makes one unit on the x-axis the same length as one unit on the y-axis.
May I print and share these worksheets with my class?
License: personal and classroom use. Teachers may print and photocopy these files for the students in their own classes, and share them in a password-protected class space (e.g. Google Classroom). Please do not resell, redistribute, or post the files on public websites. One purchase covers one teacher.